|
Download Data (XLS File) |
|
|||||
|
|||||
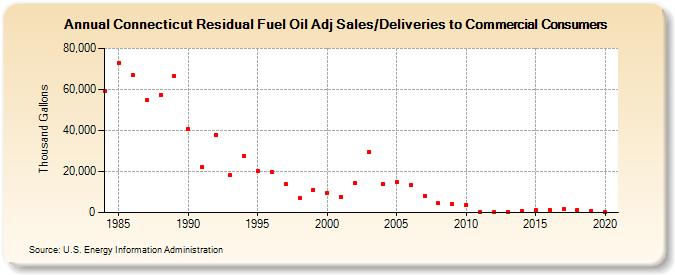
| Connecticut Residual Fuel Oil Adj Sales/Deliveries to Commercial Consumers (Thousand Gallons) | |||||
| Decade | Year-0 | Year-1 | Year-2 | Year-3 | Year-4 | Year-5 | Year-6 | Year-7 | Year-8 | Year-9 |
|---|---|---|---|---|---|---|---|---|---|---|
| 1980's | 59,417 | 73,089 | 67,146 | 54,699 | 57,317 | 66,649 | ||||
| 1990's | 40,632 | 22,267 | 37,883 | 18,068 | 27,669 | 20,030 | 19,679 | 13,705 | 6,971 | 11,158 |
| 2000's | 9,606 | 7,735 | 14,275 | 29,575 | 13,765 | 14,737 | 13,219 | 8,168 | 4,515 | 4,033 |
| 2010's | 3,841 | 322 | 327 | 404 | 783 | 1,219 | 1,489 | 1,852 | 1,127 | 1,002 |
| 2020's | 458 |
| - = No Data Reported; -- = Not Applicable; NA = Not Available; W = Withheld to avoid disclosure of individual company data. |
| Release Date: 2/9/2022 |
| Next Release Date: Suspended |