|
Download Data (XLS File) |
|
|||||
|
|||||
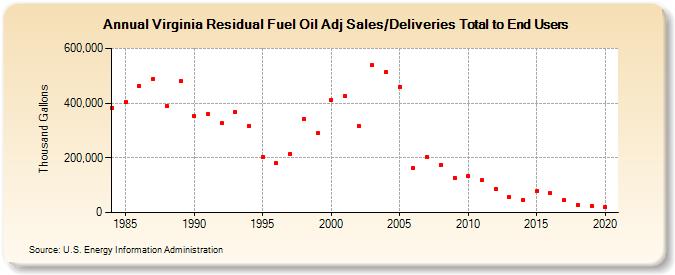
| Virginia Residual Fuel Oil Adj Sales/Deliveries Total to End Users (Thousand Gallons) | |||||
| Decade | Year-0 | Year-1 | Year-2 | Year-3 | Year-4 | Year-5 | Year-6 | Year-7 | Year-8 | Year-9 |
|---|---|---|---|---|---|---|---|---|---|---|
| 1980's | 382,569 | 403,209 | 462,440 | 489,736 | 389,214 | 480,507 | ||||
| 1990's | 352,372 | 360,830 | 326,330 | 369,227 | 317,924 | 202,843 | 180,395 | 215,402 | 341,705 | 289,562 |
| 2000's | 412,263 | 426,828 | 318,108 | 539,613 | 513,992 | 460,599 | 162,563 | 203,582 | 174,633 | 128,049 |
| 2010's | 133,962 | 117,277 | 87,297 | 56,368 | 45,702 | 77,451 | 70,913 | 45,239 | 27,524 | 24,433 |
| 2020's | 20,411 |
| - = No Data Reported; -- = Not Applicable; NA = Not Available; W = Withheld to avoid disclosure of individual company data. |
| Release Date: 2/9/2022 |
| Next Release Date: Suspended |