|
Download Data (XLS File) |
|
|||||
|
|||||
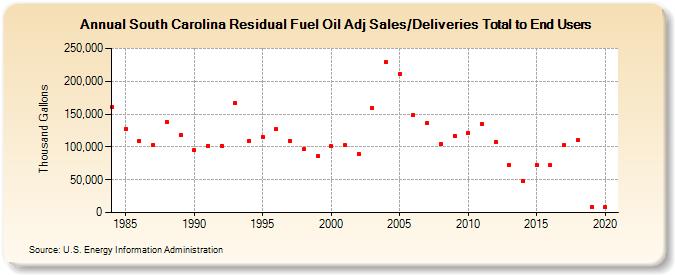
| South Carolina Residual Fuel Oil Adj Sales/Deliveries Total to End Users (Thousand Gallons) | |||||
| Decade | Year-0 | Year-1 | Year-2 | Year-3 | Year-4 | Year-5 | Year-6 | Year-7 | Year-8 | Year-9 |
|---|---|---|---|---|---|---|---|---|---|---|
| 1980's | 160,360 | 127,590 | 109,229 | 103,459 | 138,260 | 117,869 | ||||
| 1990's | 94,562 | 101,911 | 101,870 | 166,885 | 109,619 | 115,598 | 127,487 | 109,275 | 96,250 | 85,435 |
| 2000's | 101,110 | 102,208 | 89,448 | 158,607 | 229,157 | 211,564 | 148,717 | 136,716 | 104,947 | 117,012 |
| 2010's | 121,526 | 135,240 | 107,898 | 72,300 | 48,414 | 72,496 | 71,665 | 102,670 | 109,899 | 8,029 |
| 2020's | 8,060 |
| - = No Data Reported; -- = Not Applicable; NA = Not Available; W = Withheld to avoid disclosure of individual company data. |
| Release Date: 2/9/2022 |
| Next Release Date: Suspended |