|
Download Data (XLS File) |
|
|||||
|
|||||
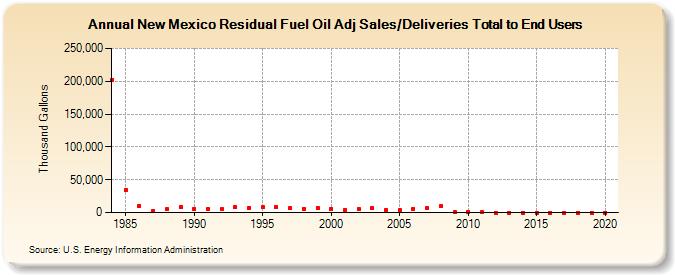
| New Mexico Residual Fuel Oil Adj Sales/Deliveries Total to End Users (Thousand Gallons) | |||||
| Decade | Year-0 | Year-1 | Year-2 | Year-3 | Year-4 | Year-5 | Year-6 | Year-7 | Year-8 | Year-9 |
|---|---|---|---|---|---|---|---|---|---|---|
| 1980's | 202,546 | 34,455 | 9,996 | 2,935 | 4,717 | 8,136 | ||||
| 1990's | 5,560 | 4,986 | 5,423 | 7,978 | 7,532 | 8,001 | 8,420 | 6,737 | 5,916 | 7,499 |
| 2000's | 5,975 | 4,036 | 5,843 | 6,589 | 4,388 | 3,614 | 5,761 | 6,795 | 9,751 | 410 |
| 2010's | 1,451 | 164 | 0 | 0 | 0 | 0 | 0 | 0 | 0 | 0 |
| 2020's | 0 |
| - = No Data Reported; -- = Not Applicable; NA = Not Available; W = Withheld to avoid disclosure of individual company data. |
| Release Date: 2/9/2022 |
| Next Release Date: Suspended |