|
Download Data (XLS File) |
|
|||||
|
|||||
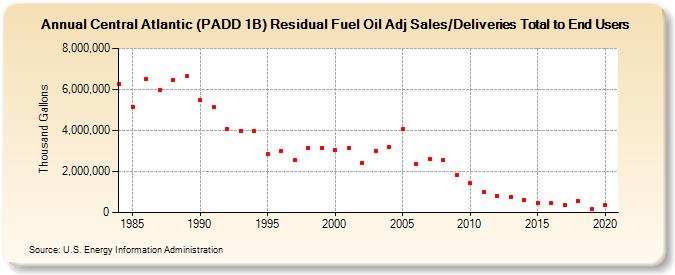
| Central Atlantic (PADD 1B) Residual Fuel Oil Adj Sales/Deliveries Total to End Users (Thousand Gallons) | |||||
| Decade | Year-0 | Year-1 | Year-2 | Year-3 | Year-4 | Year-5 | Year-6 | Year-7 | Year-8 | Year-9 |
|---|---|---|---|---|---|---|---|---|---|---|
| 1980's | 6,245,266 | 5,144,055 | 6,521,463 | 5,971,292 | 6,478,062 | 6,631,810 | ||||
| 1990's | 5,468,391 | 5,123,829 | 4,072,045 | 3,994,352 | 3,966,329 | 2,841,327 | 2,993,025 | 2,543,282 | 3,146,514 | 3,150,076 |
| 2000's | 3,071,642 | 3,137,593 | 2,422,088 | 3,013,466 | 3,184,271 | 4,049,171 | 2,377,990 | 2,604,675 | 2,567,768 | 1,824,434 |
| 2010's | 1,419,992 | 1,004,445 | 828,334 | 777,204 | 608,987 | 477,403 | 458,512 | 372,054 | 577,331 | 174,967 |
| 2020's | 377,382 |
| - = No Data Reported; -- = Not Applicable; NA = Not Available; W = Withheld to avoid disclosure of individual company data. |
| Release Date: 2/9/2022 |
| Next Release Date: Suspended |