|
Download Data (XLS File) |
|
|||||
|
|||||
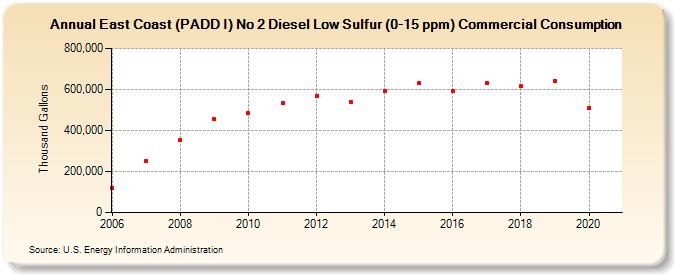
| East Coast (PADD I) No 2 Diesel Low Sulfur (0-15 ppm) Commercial Consumption (Thousand Gallons) | |||||
| Decade | Year-0 | Year-1 | Year-2 | Year-3 | Year-4 | Year-5 | Year-6 | Year-7 | Year-8 | Year-9 |
|---|---|---|---|---|---|---|---|---|---|---|
| 2000's | 119,645 | 253,587 | 354,272 | 454,558 | ||||||
| 2010's | 482,751 | 533,397 | 569,928 | 540,335 | 592,944 | 630,571 | 594,497 | 630,119 | 615,237 | 643,211 |
| 2020's | 511,096 |
| - = No Data Reported; -- = Not Applicable; NA = Not Available; W = Withheld to avoid disclosure of individual company data. |
| Release Date: 2/9/2022 |
| Next Release Date: Suspended |