|
Download Data (XLS File) |
|
|||||
|
|||||
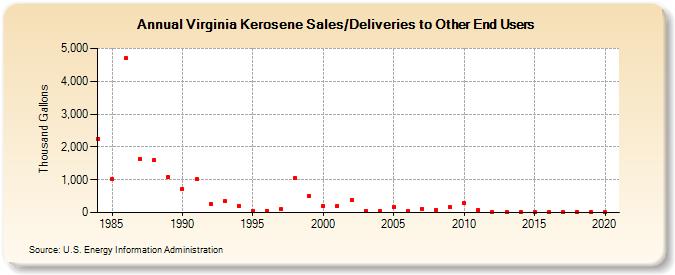
| Virginia Kerosene Sales/Deliveries to Other End Users (Thousand Gallons) | |||||
| Decade | Year-0 | Year-1 | Year-2 | Year-3 | Year-4 | Year-5 | Year-6 | Year-7 | Year-8 | Year-9 |
|---|---|---|---|---|---|---|---|---|---|---|
| 1980's | 2,251 | 1,009 | 4,697 | 1,630 | 1,599 | 1,077 | ||||
| 1990's | 721 | 1,013 | 255 | 338 | 213 | 56 | 59 | 97 | 1,057 | 516 |
| 2000's | 197 | 194 | 384 | 59 | 35 | 174 | 38 | 118 | 76 | 169 |
| 2010's | 279 | 73 | 10 | 9 | 16 | 3 | 5 | 10 | 13 | 4 |
| 2020's | 4 |
| - = No Data Reported; -- = Not Applicable; NA = Not Available; W = Withheld to avoid disclosure of individual company data. |
| Release Date: 2/9/2022 |
| Next Release Date: Suspended |