|
Download Data (XLS File) |
|
|||||
|
|||||
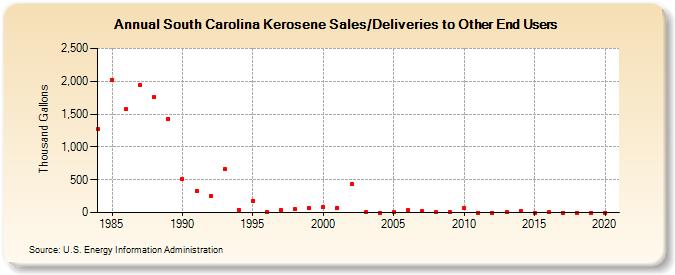
| South Carolina Kerosene Sales/Deliveries to Other End Users (Thousand Gallons) | |||||
| Decade | Year-0 | Year-1 | Year-2 | Year-3 | Year-4 | Year-5 | Year-6 | Year-7 | Year-8 | Year-9 |
|---|---|---|---|---|---|---|---|---|---|---|
| 1980's | 1,269 | 2,026 | 1,571 | 1,943 | 1,756 | 1,428 | ||||
| 1990's | 506 | 334 | 250 | 659 | 37 | 182 | 11 | 34 | 53 | 62 |
| 2000's | 79 | 71 | 431 | 15 | 0 | 2 | 38 | 22 | 1 | 12 |
| 2010's | 65 | 0 | 0 | 1 | 26 | 0 | 6 | 0 | 0 | 0 |
| 2020's | 0 |
| - = No Data Reported; -- = Not Applicable; NA = Not Available; W = Withheld to avoid disclosure of individual company data. |
| Release Date: 2/9/2022 |
| Next Release Date: Suspended |