|
Download Data (XLS File) |
|
|||||
|
|||||
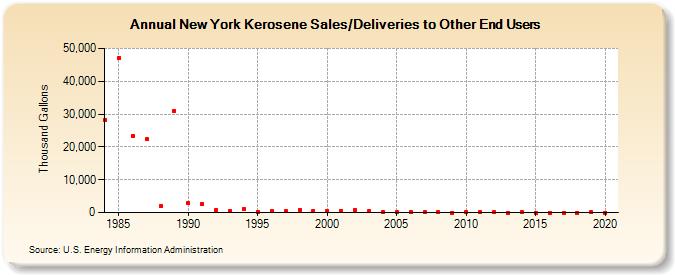
| New York Kerosene Sales/Deliveries to Other End Users (Thousand Gallons) | |||||
| Decade | Year-0 | Year-1 | Year-2 | Year-3 | Year-4 | Year-5 | Year-6 | Year-7 | Year-8 | Year-9 |
|---|---|---|---|---|---|---|---|---|---|---|
| 1980's | 28,270 | 47,179 | 23,366 | 22,294 | 1,983 | 30,988 | ||||
| 1990's | 2,829 | 2,642 | 836 | 514 | 1,127 | 255 | 337 | 381 | 887 | 544 |
| 2000's | 482 | 475 | 831 | 338 | 38 | 147 | 114 | 205 | 88 | 18 |
| 2010's | 179 | 89 | 40 | 11 | 88 | 14 | 6 | 11 | 9 | 51 |
| 2020's | 9 |
| - = No Data Reported; -- = Not Applicable; NA = Not Available; W = Withheld to avoid disclosure of individual company data. |
| Release Date: 2/9/2022 |
| Next Release Date: Suspended |