|
Download Data (XLS File) |
|
|||||
|
|||||
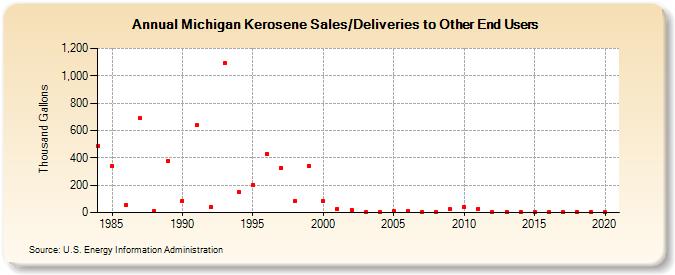
| Michigan Kerosene Sales/Deliveries to Other End Users (Thousand Gallons) | |||||
| Decade | Year-0 | Year-1 | Year-2 | Year-3 | Year-4 | Year-5 | Year-6 | Year-7 | Year-8 | Year-9 |
|---|---|---|---|---|---|---|---|---|---|---|
| 1980's | 490 | 341 | 55 | 688 | 13 | 379 | ||||
| 1990's | 88 | 637 | 41 | 1,093 | 151 | 205 | 429 | 329 | 86 | 340 |
| 2000's | 81 | 26 | 22 | 4 | 4 | 10 | 9 | 6 | 5 | 24 |
| 2010's | 39 | 29 | 1 | 6 | 2 | 2 | 2 | 1 | 1 | 1 |
| 2020's | 1 |
| - = No Data Reported; -- = Not Applicable; NA = Not Available; W = Withheld to avoid disclosure of individual company data. |
| Release Date: 2/9/2022 |
| Next Release Date: Suspended |