|
Download Data (XLS File) |
|
|||||
|
|||||
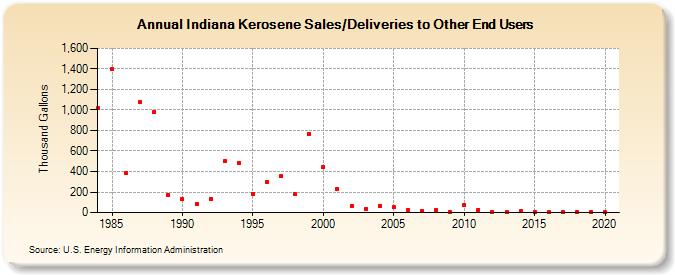
| Indiana Kerosene Sales/Deliveries to Other End Users (Thousand Gallons) | |||||
| Decade | Year-0 | Year-1 | Year-2 | Year-3 | Year-4 | Year-5 | Year-6 | Year-7 | Year-8 | Year-9 |
|---|---|---|---|---|---|---|---|---|---|---|
| 1980's | 1,015 | 1,401 | 387 | 1,074 | 978 | 169 | ||||
| 1990's | 131 | 88 | 136 | 502 | 480 | 182 | 296 | 353 | 180 | 767 |
| 2000's | 443 | 226 | 64 | 39 | 67 | 50 | 29 | 19 | 27 | 8 |
| 2010's | 77 | 29 | 4 | 3 | 14 | 6 | 3 | 3 | 3 | 4 |
| 2020's | 2 |
| - = No Data Reported; -- = Not Applicable; NA = Not Available; W = Withheld to avoid disclosure of individual company data. |
| Release Date: 2/9/2022 |
| Next Release Date: Suspended |