|
Download Data (XLS File) |
|
|||||
|
|||||
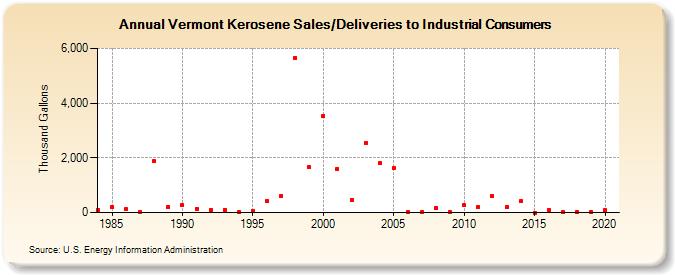
| Vermont Kerosene Sales/Deliveries to Industrial Consumers (Thousand Gallons) | |||||
| Decade | Year-0 | Year-1 | Year-2 | Year-3 | Year-4 | Year-5 | Year-6 | Year-7 | Year-8 | Year-9 |
|---|---|---|---|---|---|---|---|---|---|---|
| 1980's | 108 | 191 | 117 | 29 | 1,875 | 206 | ||||
| 1990's | 273 | 142 | 92 | 108 | 13 | 60 | 420 | 591 | 5,663 | 1,650 |
| 2000's | 3,533 | 1,605 | 470 | 2,555 | 1,809 | 1,624 | 26 | 35 | 172 | 21 |
| 2010's | 263 | 199 | 606 | 200 | 418 | 1 | 77 | 20 | 16 | 28 |
| 2020's | 93 |
| - = No Data Reported; -- = Not Applicable; NA = Not Available; W = Withheld to avoid disclosure of individual company data. |
| Release Date: 2/9/2022 |
| Next Release Date: Suspended |