|
Download Data (XLS File) |
|
|||||
|
|||||
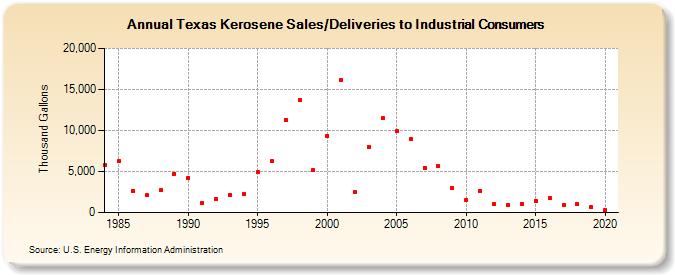
| Texas Kerosene Sales/Deliveries to Industrial Consumers (Thousand Gallons) | |||||
| Decade | Year-0 | Year-1 | Year-2 | Year-3 | Year-4 | Year-5 | Year-6 | Year-7 | Year-8 | Year-9 |
|---|---|---|---|---|---|---|---|---|---|---|
| 1980's | 5,802 | 6,225 | 2,631 | 2,129 | 2,691 | 4,734 | ||||
| 1990's | 4,243 | 1,200 | 1,646 | 2,142 | 2,284 | 4,987 | 6,293 | 11,311 | 13,693 | 5,184 |
| 2000's | 9,345 | 16,159 | 2,501 | 8,034 | 11,461 | 9,882 | 8,972 | 5,468 | 5,694 | 2,951 |
| 2010's | 1,577 | 2,668 | 1,039 | 877 | 1,063 | 1,424 | 1,755 | 934 | 1,005 | 659 |
| 2020's | 321 |
| - = No Data Reported; -- = Not Applicable; NA = Not Available; W = Withheld to avoid disclosure of individual company data. |
| Release Date: 2/9/2022 |
| Next Release Date: Suspended |