|
Download Data (XLS File) |
|
|||||
|
|||||
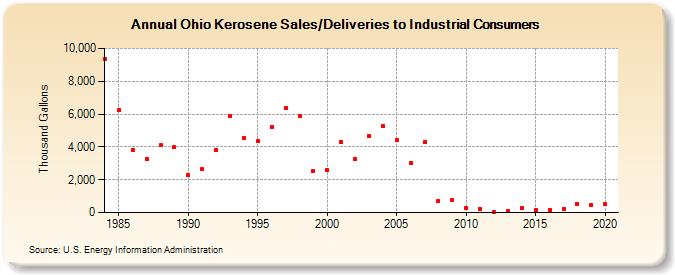
| Ohio Kerosene Sales/Deliveries to Industrial Consumers (Thousand Gallons) | |||||
| Decade | Year-0 | Year-1 | Year-2 | Year-3 | Year-4 | Year-5 | Year-6 | Year-7 | Year-8 | Year-9 |
|---|---|---|---|---|---|---|---|---|---|---|
| 1980's | 9,374 | 6,266 | 3,813 | 3,255 | 4,099 | 3,973 | ||||
| 1990's | 2,270 | 2,656 | 3,839 | 5,906 | 4,544 | 4,355 | 5,204 | 6,351 | 5,862 | 2,560 |
| 2000's | 2,575 | 4,319 | 3,243 | 4,669 | 5,286 | 4,399 | 3,025 | 4,269 | 675 | 794 |
| 2010's | 277 | 247 | 58 | 103 | 296 | 174 | 138 | 238 | 514 | 431 |
| 2020's | 506 |
| - = No Data Reported; -- = Not Applicable; NA = Not Available; W = Withheld to avoid disclosure of individual company data. |
| Release Date: 2/9/2022 |
| Next Release Date: Suspended |