|
Download Data (XLS File) |
|
|||||
|
|||||
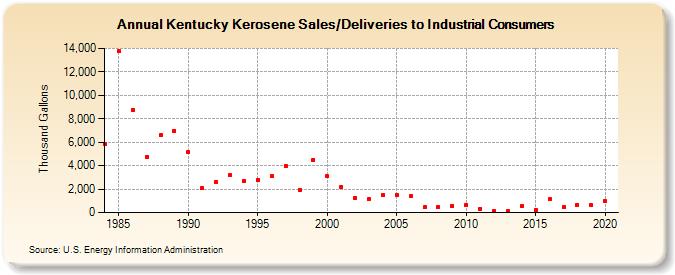
| Kentucky Kerosene Sales/Deliveries to Industrial Consumers (Thousand Gallons) | |||||
| Decade | Year-0 | Year-1 | Year-2 | Year-3 | Year-4 | Year-5 | Year-6 | Year-7 | Year-8 | Year-9 |
|---|---|---|---|---|---|---|---|---|---|---|
| 1980's | 5,857 | 13,742 | 8,747 | 4,769 | 6,593 | 6,990 | ||||
| 1990's | 5,146 | 2,084 | 2,622 | 3,190 | 2,699 | 2,813 | 3,092 | 3,973 | 1,964 | 4,509 |
| 2000's | 3,093 | 2,183 | 1,256 | 1,138 | 1,490 | 1,480 | 1,378 | 440 | 457 | 599 |
| 2010's | 646 | 328 | 138 | 106 | 579 | 248 | 1,127 | 490 | 662 | 619 |
| 2020's | 962 |
| - = No Data Reported; -- = Not Applicable; NA = Not Available; W = Withheld to avoid disclosure of individual company data. |
| Release Date: 2/9/2022 |
| Next Release Date: Suspended |