|
Download Data (XLS File) |
|
|||||
|
|||||
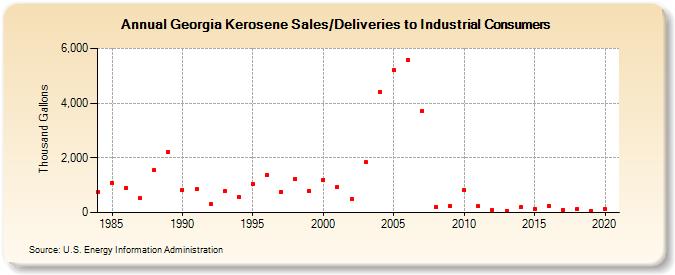
| Georgia Kerosene Sales/Deliveries to Industrial Consumers (Thousand Gallons) | |||||
| Decade | Year-0 | Year-1 | Year-2 | Year-3 | Year-4 | Year-5 | Year-6 | Year-7 | Year-8 | Year-9 |
|---|---|---|---|---|---|---|---|---|---|---|
| 1980's | 764 | 1,093 | 913 | 517 | 1,551 | 2,226 | ||||
| 1990's | 837 | 844 | 301 | 783 | 555 | 1,053 | 1,379 | 762 | 1,240 | 799 |
| 2000's | 1,201 | 940 | 493 | 1,837 | 4,409 | 5,210 | 5,590 | 3,729 | 200 | 238 |
| 2010's | 825 | 223 | 91 | 60 | 190 | 141 | 234 | 104 | 134 | 58 |
| 2020's | 114 |
| - = No Data Reported; -- = Not Applicable; NA = Not Available; W = Withheld to avoid disclosure of individual company data. |
| Release Date: 2/9/2022 |
| Next Release Date: Suspended |