|
Download Data (XLS File) |
|
|||||
|
|||||
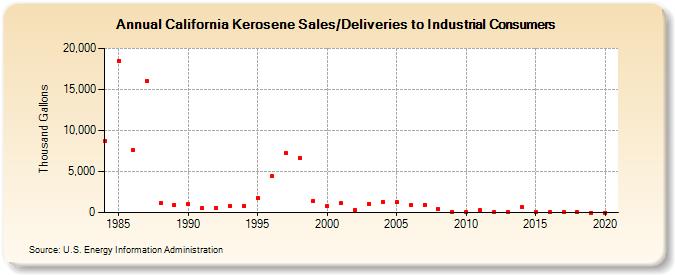
| California Kerosene Sales/Deliveries to Industrial Consumers (Thousand Gallons) | |||||
| Decade | Year-0 | Year-1 | Year-2 | Year-3 | Year-4 | Year-5 | Year-6 | Year-7 | Year-8 | Year-9 |
|---|---|---|---|---|---|---|---|---|---|---|
| 1980's | 8,726 | 18,517 | 7,583 | 16,013 | 1,132 | 904 | ||||
| 1990's | 992 | 557 | 588 | 850 | 807 | 1,782 | 4,404 | 7,261 | 6,637 | 1,383 |
| 2000's | 791 | 1,134 | 308 | 1,062 | 1,288 | 1,275 | 942 | 959 | 421 | 104 |
| 2010's | 107 | 278 | 115 | 47 | 677 | 128 | 36 | 17 | 13 | 4 |
| 2020's | 4 |
| - = No Data Reported; -- = Not Applicable; NA = Not Available; W = Withheld to avoid disclosure of individual company data. |
| Release Date: 2/9/2022 |
| Next Release Date: Suspended |