|
Download Data (XLS File) |
|
|||||
|
|||||
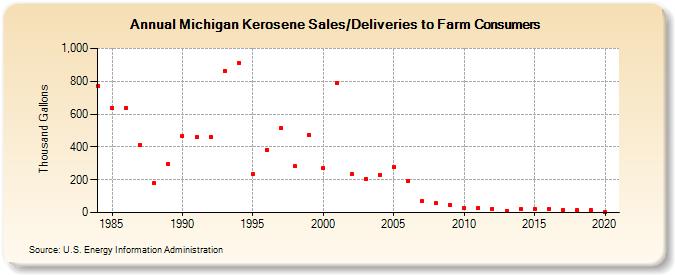
| Michigan Kerosene Sales/Deliveries to Farm Consumers (Thousand Gallons) | |||||
| Decade | Year-0 | Year-1 | Year-2 | Year-3 | Year-4 | Year-5 | Year-6 | Year-7 | Year-8 | Year-9 |
|---|---|---|---|---|---|---|---|---|---|---|
| 1980's | 773 | 639 | 638 | 414 | 178 | 295 | ||||
| 1990's | 468 | 458 | 461 | 864 | 914 | 233 | 382 | 515 | 281 | 474 |
| 2000's | 269 | 787 | 234 | 207 | 231 | 279 | 194 | 68 | 56 | 48 |
| 2010's | 27 | 29 | 24 | 11 | 23 | 22 | 22 | 15 | 13 | 14 |
| 2020's | 6 |
| - = No Data Reported; -- = Not Applicable; NA = Not Available; W = Withheld to avoid disclosure of individual company data. |
| Release Date: 2/9/2022 |
| Next Release Date: Suspended |