|
Download Data (XLS File) |
|
|||||
|
|||||
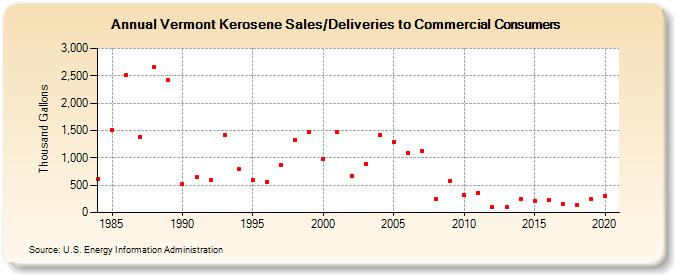
| Vermont Kerosene Sales/Deliveries to Commercial Consumers (Thousand Gallons) | |||||
| Decade | Year-0 | Year-1 | Year-2 | Year-3 | Year-4 | Year-5 | Year-6 | Year-7 | Year-8 | Year-9 |
|---|---|---|---|---|---|---|---|---|---|---|
| 1980's | 606 | 1,515 | 2,515 | 1,384 | 2,665 | 2,422 | ||||
| 1990's | 523 | 651 | 596 | 1,423 | 799 | 600 | 566 | 865 | 1,327 | 1,478 |
| 2000's | 975 | 1,470 | 670 | 894 | 1,413 | 1,295 | 1,088 | 1,127 | 244 | 585 |
| 2010's | 323 | 363 | 107 | 110 | 248 | 218 | 235 | 154 | 143 | 248 |
| 2020's | 308 |
| - = No Data Reported; -- = Not Applicable; NA = Not Available; W = Withheld to avoid disclosure of individual company data. |
| Release Date: 2/9/2022 |
| Next Release Date: Suspended |