|
Download Data (XLS File) |
|
|||||
|
|||||
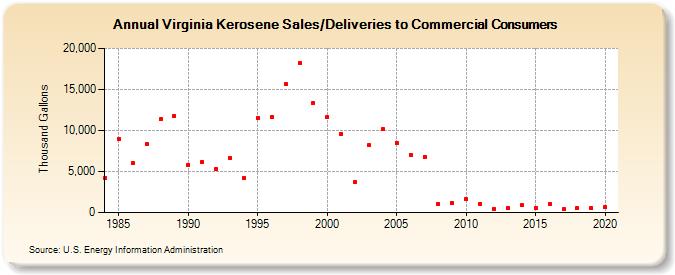
| Virginia Kerosene Sales/Deliveries to Commercial Consumers (Thousand Gallons) | |||||
| Decade | Year-0 | Year-1 | Year-2 | Year-3 | Year-4 | Year-5 | Year-6 | Year-7 | Year-8 | Year-9 |
|---|---|---|---|---|---|---|---|---|---|---|
| 1980's | 4,240 | 8,976 | 6,049 | 8,293 | 11,350 | 11,771 | ||||
| 1990's | 5,851 | 6,214 | 5,325 | 6,681 | 4,231 | 11,566 | 11,651 | 15,615 | 18,190 | 13,327 |
| 2000's | 11,604 | 9,564 | 3,688 | 8,190 | 10,171 | 8,520 | 7,073 | 6,789 | 1,059 | 1,165 |
| 2010's | 1,601 | 1,076 | 449 | 527 | 873 | 547 | 1,068 | 401 | 503 | 549 |
| 2020's | 635 |
| - = No Data Reported; -- = Not Applicable; NA = Not Available; W = Withheld to avoid disclosure of individual company data. |
| Release Date: 2/9/2022 |
| Next Release Date: Suspended |