|
Download Data (XLS File) |
|
|||||
|
|||||
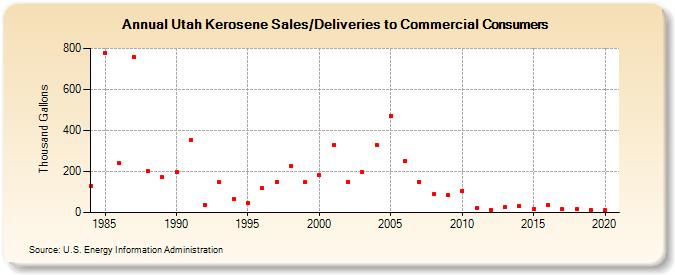
| Utah Kerosene Sales/Deliveries to Commercial Consumers (Thousand Gallons) | |||||
| Decade | Year-0 | Year-1 | Year-2 | Year-3 | Year-4 | Year-5 | Year-6 | Year-7 | Year-8 | Year-9 |
|---|---|---|---|---|---|---|---|---|---|---|
| 1980's | 128 | 779 | 240 | 760 | 202 | 172 | ||||
| 1990's | 199 | 356 | 39 | 147 | 65 | 45 | 119 | 149 | 225 | 149 |
| 2000's | 181 | 329 | 148 | 196 | 330 | 471 | 252 | 150 | 90 | 84 |
| 2010's | 107 | 20 | 14 | 26 | 32 | 18 | 35 | 15 | 17 | 11 |
| 2020's | 11 |
| - = No Data Reported; -- = Not Applicable; NA = Not Available; W = Withheld to avoid disclosure of individual company data. |
| Release Date: 2/9/2022 |
| Next Release Date: Suspended |