|
Download Data (XLS File) |
|
|||||
|
|||||
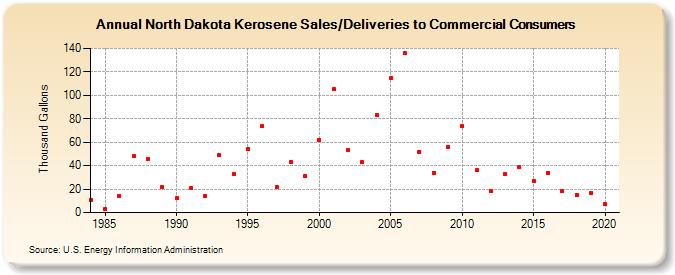
| North Dakota Kerosene Sales/Deliveries to Commercial Consumers (Thousand Gallons) | |||||
| Decade | Year-0 | Year-1 | Year-2 | Year-3 | Year-4 | Year-5 | Year-6 | Year-7 | Year-8 | Year-9 |
|---|---|---|---|---|---|---|---|---|---|---|
| 1980's | 11 | 3 | 14 | 48 | 46 | 22 | ||||
| 1990's | 12 | 21 | 14 | 49 | 33 | 54 | 74 | 22 | 43 | 31 |
| 2000's | 62 | 105 | 53 | 43 | 83 | 115 | 136 | 52 | 34 | 56 |
| 2010's | 74 | 36 | 18 | 33 | 39 | 27 | 34 | 18 | 15 | 17 |
| 2020's | 7 |
| - = No Data Reported; -- = Not Applicable; NA = Not Available; W = Withheld to avoid disclosure of individual company data. |
| Release Date: 2/9/2022 |
| Next Release Date: Suspended |