|
Download Data (XLS File) |
|
|||||
|
|||||
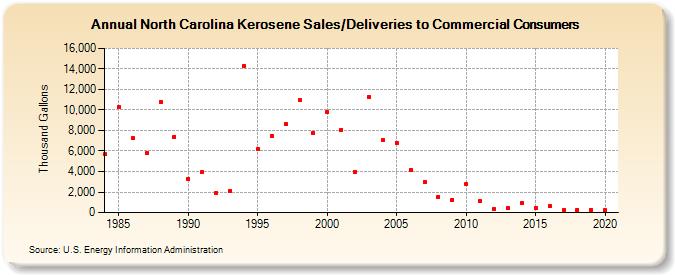
| North Carolina Kerosene Sales/Deliveries to Commercial Consumers (Thousand Gallons) | |||||
| Decade | Year-0 | Year-1 | Year-2 | Year-3 | Year-4 | Year-5 | Year-6 | Year-7 | Year-8 | Year-9 |
|---|---|---|---|---|---|---|---|---|---|---|
| 1980's | 5,671 | 10,284 | 7,218 | 5,773 | 10,794 | 7,407 | ||||
| 1990's | 3,284 | 3,921 | 1,931 | 2,119 | 14,288 | 6,178 | 7,496 | 8,611 | 10,943 | 7,753 |
| 2000's | 9,820 | 8,079 | 3,978 | 11,310 | 7,067 | 6,805 | 4,191 | 2,990 | 1,563 | 1,251 |
| 2010's | 2,745 | 1,119 | 369 | 420 | 936 | 432 | 626 | 281 | 282 | 264 |
| 2020's | 238 |
| - = No Data Reported; -- = Not Applicable; NA = Not Available; W = Withheld to avoid disclosure of individual company data. |
| Release Date: 2/9/2022 |
| Next Release Date: Suspended |