|
Download Data (XLS File) |
|
|||||
|
|||||
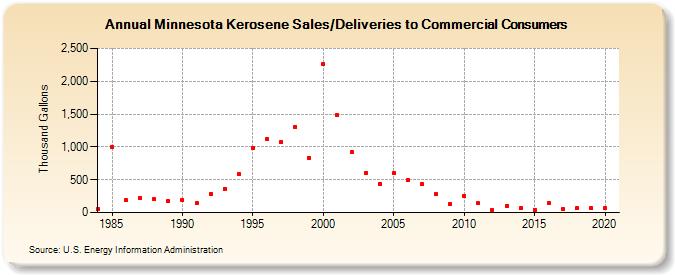
| Minnesota Kerosene Sales/Deliveries to Commercial Consumers (Thousand Gallons) | |||||
| Decade | Year-0 | Year-1 | Year-2 | Year-3 | Year-4 | Year-5 | Year-6 | Year-7 | Year-8 | Year-9 |
|---|---|---|---|---|---|---|---|---|---|---|
| 1980's | 54 | 1,002 | 185 | 227 | 200 | 171 | ||||
| 1990's | 190 | 145 | 282 | 366 | 587 | 979 | 1,123 | 1,072 | 1,308 | 837 |
| 2000's | 2,260 | 1,479 | 915 | 603 | 437 | 601 | 490 | 436 | 277 | 130 |
| 2010's | 250 | 139 | 36 | 107 | 68 | 43 | 153 | 48 | 64 | 69 |
| 2020's | 70 |
| - = No Data Reported; -- = Not Applicable; NA = Not Available; W = Withheld to avoid disclosure of individual company data. |
| Release Date: 2/9/2022 |
| Next Release Date: Suspended |