|
Download Data (XLS File) |
|
|||||
|
|||||
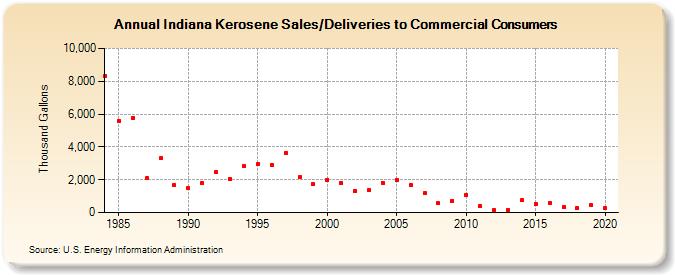
| Indiana Kerosene Sales/Deliveries to Commercial Consumers (Thousand Gallons) | |||||
| Decade | Year-0 | Year-1 | Year-2 | Year-3 | Year-4 | Year-5 | Year-6 | Year-7 | Year-8 | Year-9 |
|---|---|---|---|---|---|---|---|---|---|---|
| 1980's | 8,302 | 5,607 | 5,761 | 2,079 | 3,294 | 1,668 | ||||
| 1990's | 1,467 | 1,811 | 2,460 | 2,035 | 2,814 | 2,947 | 2,887 | 3,639 | 2,162 | 1,721 |
| 2000's | 2,007 | 1,828 | 1,299 | 1,372 | 1,830 | 1,984 | 1,660 | 1,172 | 553 | 724 |
| 2010's | 1,096 | 378 | 142 | 140 | 749 | 516 | 600 | 345 | 267 | 431 |
| 2020's | 249 |
| - = No Data Reported; -- = Not Applicable; NA = Not Available; W = Withheld to avoid disclosure of individual company data. |
| Release Date: 2/9/2022 |
| Next Release Date: Suspended |