|
Download Data (XLS File) |
|
|||||
|
|||||
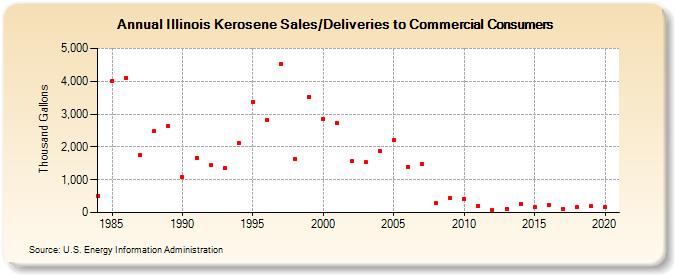
| Illinois Kerosene Sales/Deliveries to Commercial Consumers (Thousand Gallons) | |||||
| Decade | Year-0 | Year-1 | Year-2 | Year-3 | Year-4 | Year-5 | Year-6 | Year-7 | Year-8 | Year-9 |
|---|---|---|---|---|---|---|---|---|---|---|
| 1980's | 517 | 4,014 | 4,108 | 1,754 | 2,481 | 2,651 | ||||
| 1990's | 1,076 | 1,667 | 1,444 | 1,345 | 2,105 | 3,375 | 2,826 | 4,531 | 1,636 | 3,534 |
| 2000's | 2,859 | 2,715 | 1,560 | 1,536 | 1,883 | 2,217 | 1,400 | 1,494 | 287 | 440 |
| 2010's | 421 | 211 | 71 | 121 | 256 | 160 | 238 | 115 | 164 | 197 |
| 2020's | 155 |
| - = No Data Reported; -- = Not Applicable; NA = Not Available; W = Withheld to avoid disclosure of individual company data. |
| Release Date: 2/9/2022 |
| Next Release Date: Suspended |