|
Download Data (XLS File) |
|
|||||
|
|||||
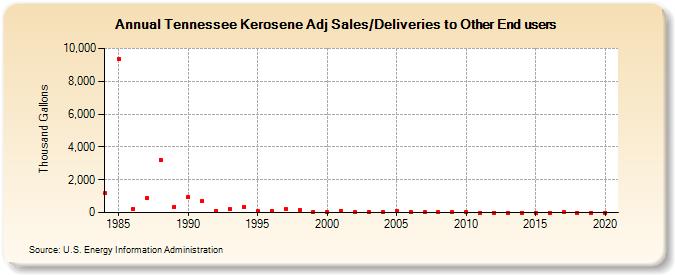
| Tennessee Kerosene Adj Sales/Deliveries to Other End users (Thousand Gallons) | |||||
| Decade | Year-0 | Year-1 | Year-2 | Year-3 | Year-4 | Year-5 | Year-6 | Year-7 | Year-8 | Year-9 |
|---|---|---|---|---|---|---|---|---|---|---|
| 1980's | 1,176 | 9,369 | 225 | 867 | 3,227 | 357 | ||||
| 1990's | 933 | 708 | 114 | 204 | 354 | 74 | 104 | 228 | 153 | 53 |
| 2000's | 35 | 119 | 62 | 39 | 52 | 93 | 46 | 16 | 10 | 10 |
| 2010's | 64 | 0 | 2 | 0 | 1 | 1 | 1 | 4 | 0 | 0 |
| 2020's | 0 |
| - = No Data Reported; -- = Not Applicable; NA = Not Available; W = Withheld to avoid disclosure of individual company data. |
| Release Date: 2/9/2022 |
| Next Release Date: Suspended |