|
Download Data (XLS File) |
|
|||||
|
|||||
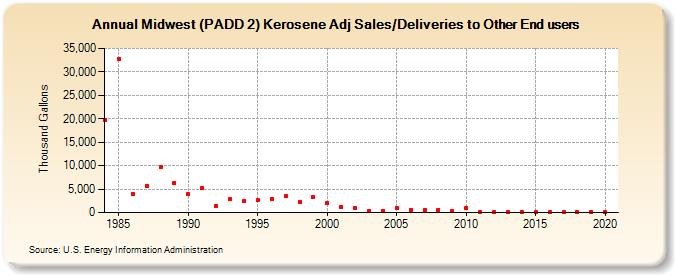
| Midwest (PADD 2) Kerosene Adj Sales/Deliveries to Other End users (Thousand Gallons) | |||||
| Decade | Year-0 | Year-1 | Year-2 | Year-3 | Year-4 | Year-5 | Year-6 | Year-7 | Year-8 | Year-9 |
|---|---|---|---|---|---|---|---|---|---|---|
| 1980's | 19,733 | 32,688 | 3,930 | 5,764 | 9,678 | 6,322 | ||||
| 1990's | 3,882 | 5,219 | 1,437 | 2,814 | 2,429 | 2,603 | 2,916 | 3,462 | 2,292 | 3,238 |
| 2000's | 1,991 | 1,137 | 1,010 | 370 | 430 | 985 | 581 | 520 | 620 | 240 |
| 2010's | 976 | 155 | 37 | 45 | 126 | 49 | 64 | 32 | 34 | 72 |
| 2020's | 68 |
| - = No Data Reported; -- = Not Applicable; NA = Not Available; W = Withheld to avoid disclosure of individual company data. |
| Release Date: 2/9/2022 |
| Next Release Date: Suspended |