|
Download Data (XLS File) |
|
|||||
|
|||||
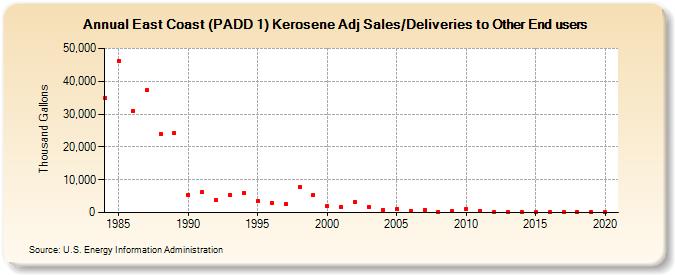
| East Coast (PADD 1) Kerosene Adj Sales/Deliveries to Other End users (Thousand Gallons) | |||||
| Decade | Year-0 | Year-1 | Year-2 | Year-3 | Year-4 | Year-5 | Year-6 | Year-7 | Year-8 | Year-9 |
|---|---|---|---|---|---|---|---|---|---|---|
| 1980's | 34,916 | 46,232 | 31,052 | 37,222 | 23,936 | 24,205 | ||||
| 1990's | 5,477 | 6,328 | 3,687 | 5,473 | 6,055 | 3,476 | 3,008 | 2,563 | 7,916 | 5,491 |
| 2000's | 1,957 | 1,776 | 3,362 | 1,842 | 884 | 1,046 | 438 | 795 | 248 | 336 |
| 2010's | 1,110 | 558 | 120 | 83 | 262 | 49 | 89 | 52 | 136 | 128 |
| 2020's | 98 |
| - = No Data Reported; -- = Not Applicable; NA = Not Available; W = Withheld to avoid disclosure of individual company data. |
| Release Date: 2/9/2022 |
| Next Release Date: Suspended |