|
Download Data (XLS File) |
|
|||||
|
|||||
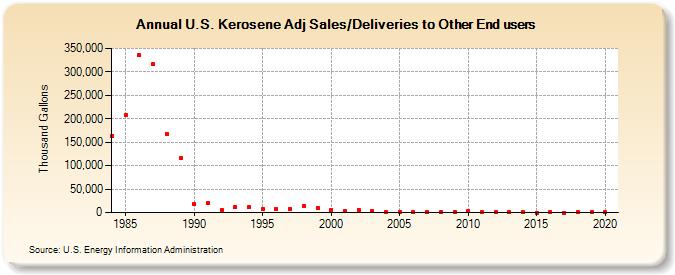
| U.S. Kerosene Adj Sales/Deliveries to Other End users (Thousand Gallons) | |||||
| Decade | Year-0 | Year-1 | Year-2 | Year-3 | Year-4 | Year-5 | Year-6 | Year-7 | Year-8 | Year-9 |
|---|---|---|---|---|---|---|---|---|---|---|
| 1980's | 163,034 | 208,139 | 334,908 | 315,900 | 167,583 | 115,750 | ||||
| 1990's | 17,780 | 19,678 | 6,382 | 10,805 | 10,957 | 7,576 | 7,223 | 7,054 | 13,420 | 10,521 |
| 2000's | 5,921 | 3,535 | 5,372 | 2,572 | 1,683 | 2,124 | 1,435 | 1,520 | 1,036 | 633 |
| 2010's | 2,297 | 809 | 245 | 155 | 422 | 116 | 178 | 124 | 226 | 227 |
| 2020's | 178 |
| - = No Data Reported; -- = Not Applicable; NA = Not Available; W = Withheld to avoid disclosure of individual company data. |
| Release Date: 2/9/2022 |
| Next Release Date: Suspended |