|
Download Data (XLS File) |
|
|||||
|
|||||
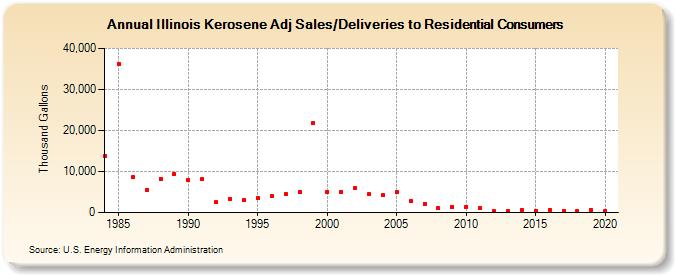
| Illinois Kerosene Adj Sales/Deliveries to Residential Consumers (Thousand Gallons) | |||||
| Decade | Year-0 | Year-1 | Year-2 | Year-3 | Year-4 | Year-5 | Year-6 | Year-7 | Year-8 | Year-9 |
|---|---|---|---|---|---|---|---|---|---|---|
| 1980's | 13,759 | 36,288 | 8,571 | 5,523 | 8,177 | 9,435 | ||||
| 1990's | 7,853 | 8,090 | 2,544 | 3,388 | 3,030 | 3,521 | 4,020 | 4,576 | 5,053 | 21,850 |
| 2000's | 5,102 | 5,040 | 5,981 | 4,449 | 4,208 | 4,913 | 2,837 | 2,186 | 996 | 1,324 |
| 2010's | 1,431 | 1,010 | 298 | 420 | 699 | 466 | 742 | 464 | 347 | 602 |
| 2020's | 381 |
| - = No Data Reported; -- = Not Applicable; NA = Not Available; W = Withheld to avoid disclosure of individual company data. |
| Release Date: 2/9/2022 |
| Next Release Date: Suspended |