|
Download Data (XLS File) |
|
|||||
|
|||||
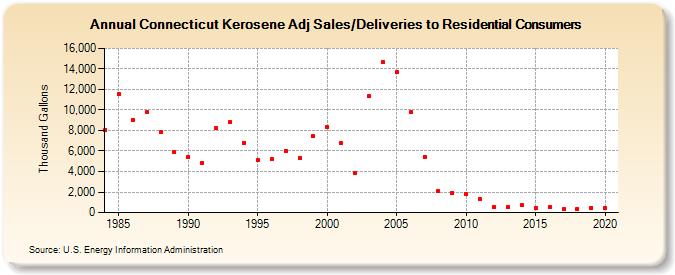
| Connecticut Kerosene Adj Sales/Deliveries to Residential Consumers (Thousand Gallons) | |||||
| Decade | Year-0 | Year-1 | Year-2 | Year-3 | Year-4 | Year-5 | Year-6 | Year-7 | Year-8 | Year-9 |
|---|---|---|---|---|---|---|---|---|---|---|
| 1980's | 8,035 | 11,509 | 9,001 | 9,778 | 7,811 | 5,878 | ||||
| 1990's | 5,420 | 4,855 | 8,211 | 8,845 | 6,811 | 5,127 | 5,217 | 6,020 | 5,304 | 7,413 |
| 2000's | 8,358 | 6,742 | 3,870 | 11,336 | 14,660 | 13,671 | 9,758 | 5,428 | 2,061 | 1,938 |
| 2010's | 1,794 | 1,303 | 580 | 523 | 702 | 433 | 557 | 355 | 329 | 472 |
| 2020's | 446 |
| - = No Data Reported; -- = Not Applicable; NA = Not Available; W = Withheld to avoid disclosure of individual company data. |
| Release Date: 2/9/2022 |
| Next Release Date: Suspended |