|
Download Data (XLS File) |
|
|||||
|
|||||
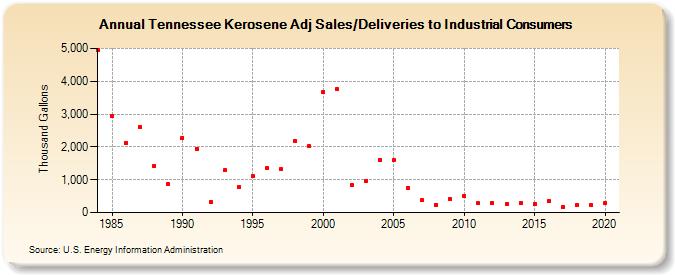
| Tennessee Kerosene Adj Sales/Deliveries to Industrial Consumers (Thousand Gallons) | |||||
| Decade | Year-0 | Year-1 | Year-2 | Year-3 | Year-4 | Year-5 | Year-6 | Year-7 | Year-8 | Year-9 |
|---|---|---|---|---|---|---|---|---|---|---|
| 1980's | 4,942 | 2,940 | 2,131 | 2,599 | 1,425 | 860 | ||||
| 1990's | 2,281 | 1,946 | 325 | 1,287 | 778 | 1,110 | 1,357 | 1,317 | 2,176 | 2,018 |
| 2000's | 3,676 | 3,752 | 840 | 967 | 1,610 | 1,586 | 756 | 376 | 244 | 410 |
| 2010's | 504 | 277 | 293 | 265 | 289 | 258 | 341 | 177 | 223 | 224 |
| 2020's | 277 |
| - = No Data Reported; -- = Not Applicable; NA = Not Available; W = Withheld to avoid disclosure of individual company data. |
| Release Date: 2/9/2022 |
| Next Release Date: Suspended |