|
Download Data (XLS File) |
|
|||||
|
|||||
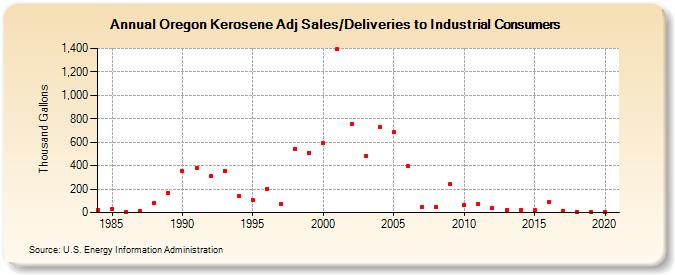
| Oregon Kerosene Adj Sales/Deliveries to Industrial Consumers (Thousand Gallons) | |||||
| Decade | Year-0 | Year-1 | Year-2 | Year-3 | Year-4 | Year-5 | Year-6 | Year-7 | Year-8 | Year-9 |
|---|---|---|---|---|---|---|---|---|---|---|
| 1980's | 22 | 30 | 7 | 14 | 80 | 167 | ||||
| 1990's | 352 | 383 | 309 | 355 | 141 | 103 | 205 | 74 | 543 | 511 |
| 2000's | 591 | 1,392 | 759 | 486 | 731 | 685 | 396 | 47 | 47 | 242 |
| 2010's | 63 | 76 | 36 | 23 | 22 | 21 | 93 | 16 | 5 | 9 |
| 2020's | 8 |
| - = No Data Reported; -- = Not Applicable; NA = Not Available; W = Withheld to avoid disclosure of individual company data. |
| Release Date: 2/9/2022 |
| Next Release Date: Suspended |