|
Download Data (XLS File) |
|
|||||
|
|||||
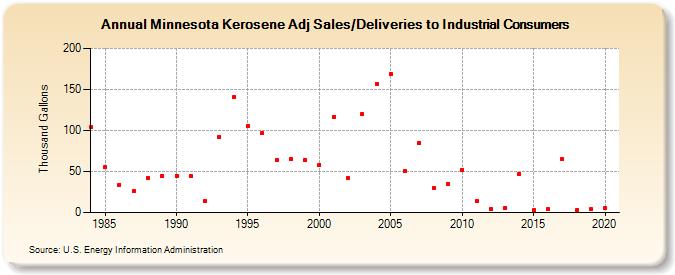
| Minnesota Kerosene Adj Sales/Deliveries to Industrial Consumers (Thousand Gallons) | |||||
| Decade | Year-0 | Year-1 | Year-2 | Year-3 | Year-4 | Year-5 | Year-6 | Year-7 | Year-8 | Year-9 |
|---|---|---|---|---|---|---|---|---|---|---|
| 1980's | 104 | 55 | 34 | 26 | 42 | 45 | ||||
| 1990's | 45 | 44 | 14 | 92 | 141 | 106 | 97 | 64 | 65 | 64 |
| 2000's | 58 | 117 | 42 | 120 | 157 | 169 | 51 | 85 | 30 | 35 |
| 2010's | 52 | 14 | 4 | 6 | 47 | 3 | 4 | 65 | 3 | 4 |
| 2020's | 5 |
| - = No Data Reported; -- = Not Applicable; NA = Not Available; W = Withheld to avoid disclosure of individual company data. |
| Release Date: 2/9/2022 |
| Next Release Date: Suspended |