|
Download Data (XLS File) |
|
|||||
|
|||||
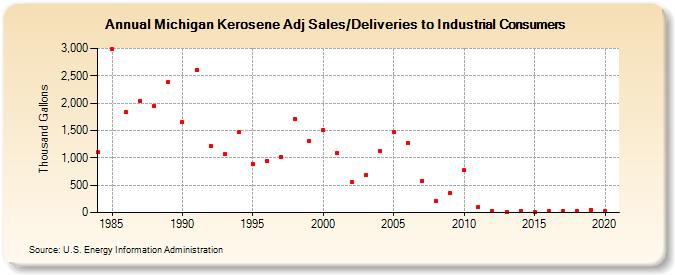
| Michigan Kerosene Adj Sales/Deliveries to Industrial Consumers (Thousand Gallons) | |||||
| Decade | Year-0 | Year-1 | Year-2 | Year-3 | Year-4 | Year-5 | Year-6 | Year-7 | Year-8 | Year-9 |
|---|---|---|---|---|---|---|---|---|---|---|
| 1980's | 1,104 | 2,984 | 1,833 | 2,044 | 1,945 | 2,387 | ||||
| 1990's | 1,649 | 2,608 | 1,216 | 1,068 | 1,464 | 894 | 937 | 1,014 | 1,713 | 1,312 |
| 2000's | 1,507 | 1,085 | 553 | 683 | 1,122 | 1,477 | 1,262 | 576 | 209 | 355 |
| 2010's | 773 | 100 | 33 | 19 | 34 | 10 | 21 | 23 | 29 | 49 |
| 2020's | 21 |
| - = No Data Reported; -- = Not Applicable; NA = Not Available; W = Withheld to avoid disclosure of individual company data. |
| Release Date: 2/9/2022 |
| Next Release Date: Suspended |