|
Download Data (XLS File) |
|
|||||
|
|||||
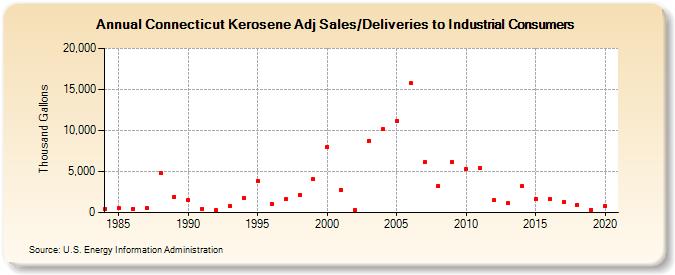
| Connecticut Kerosene Adj Sales/Deliveries to Industrial Consumers (Thousand Gallons) | |||||
| Decade | Year-0 | Year-1 | Year-2 | Year-3 | Year-4 | Year-5 | Year-6 | Year-7 | Year-8 | Year-9 |
|---|---|---|---|---|---|---|---|---|---|---|
| 1980's | 451 | 520 | 486 | 553 | 4,842 | 1,910 | ||||
| 1990's | 1,516 | 484 | 279 | 789 | 1,782 | 3,904 | 1,062 | 1,608 | 2,180 | 4,045 |
| 2000's | 8,013 | 2,775 | 312 | 8,755 | 10,157 | 11,147 | 15,727 | 6,143 | 3,261 | 6,133 |
| 2010's | 5,297 | 5,408 | 1,507 | 1,119 | 3,175 | 1,633 | 1,653 | 1,303 | 942 | 343 |
| 2020's | 809 |
| - = No Data Reported; -- = Not Applicable; NA = Not Available; W = Withheld to avoid disclosure of individual company data. |
| Release Date: 2/9/2022 |
| Next Release Date: Suspended |