|
Download Data (XLS File) |
|
|||||
|
|||||
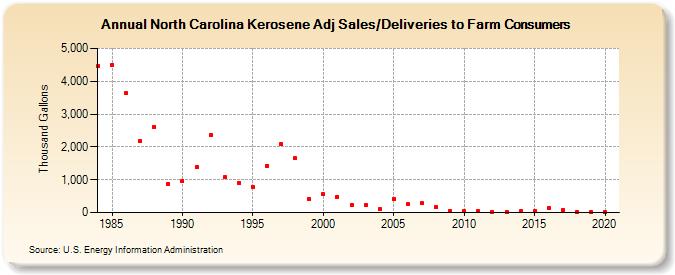
| North Carolina Kerosene Adj Sales/Deliveries to Farm Consumers (Thousand Gallons) | |||||
| Decade | Year-0 | Year-1 | Year-2 | Year-3 | Year-4 | Year-5 | Year-6 | Year-7 | Year-8 | Year-9 |
|---|---|---|---|---|---|---|---|---|---|---|
| 1980's | 4,458 | 4,506 | 3,633 | 2,170 | 2,617 | 873 | ||||
| 1990's | 951 | 1,376 | 2,359 | 1,075 | 902 | 781 | 1,433 | 2,081 | 1,651 | 415 |
| 2000's | 555 | 484 | 227 | 222 | 96 | 418 | 251 | 281 | 161 | 49 |
| 2010's | 36 | 38 | 24 | 23 | 36 | 61 | 136 | 69 | 10 | 12 |
| 2020's | 16 |
| - = No Data Reported; -- = Not Applicable; NA = Not Available; W = Withheld to avoid disclosure of individual company data. |
| Release Date: 2/9/2022 |
| Next Release Date: Suspended |