|
Download Data (XLS File) |
|
|||||
|
|||||
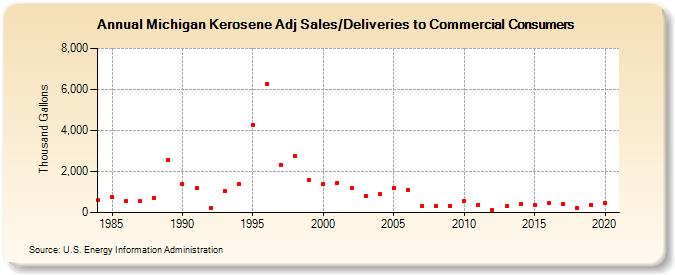
| Michigan Kerosene Adj Sales/Deliveries to Commercial Consumers (Thousand Gallons) | |||||
| Decade | Year-0 | Year-1 | Year-2 | Year-3 | Year-4 | Year-5 | Year-6 | Year-7 | Year-8 | Year-9 |
|---|---|---|---|---|---|---|---|---|---|---|
| 1980's | 603 | 735 | 570 | 543 | 705 | 2,562 | ||||
| 1990's | 1,394 | 1,189 | 213 | 1,067 | 1,374 | 4,285 | 6,278 | 2,331 | 2,754 | 1,567 |
| 2000's | 1,380 | 1,460 | 1,189 | 796 | 910 | 1,194 | 1,105 | 330 | 302 | 335 |
| 2010's | 566 | 392 | 143 | 300 | 396 | 370 | 461 | 424 | 223 | 379 |
| 2020's | 461 |
| - = No Data Reported; -- = Not Applicable; NA = Not Available; W = Withheld to avoid disclosure of individual company data. |
| Release Date: 2/9/2022 |
| Next Release Date: Suspended |