|
Download Data (XLS File) |
|
|||||
|
|||||
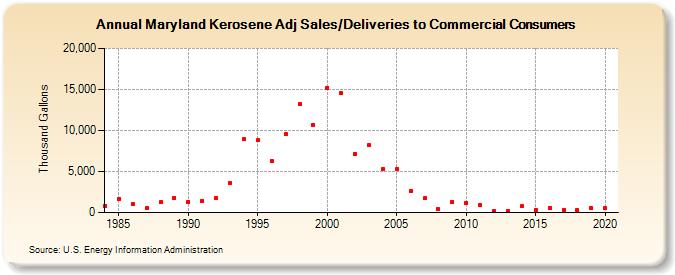
| Maryland Kerosene Adj Sales/Deliveries to Commercial Consumers (Thousand Gallons) | |||||
| Decade | Year-0 | Year-1 | Year-2 | Year-3 | Year-4 | Year-5 | Year-6 | Year-7 | Year-8 | Year-9 |
|---|---|---|---|---|---|---|---|---|---|---|
| 1980's | 853 | 1,703 | 1,054 | 553 | 1,228 | 1,820 | ||||
| 1990's | 1,317 | 1,451 | 1,767 | 3,582 | 8,931 | 8,807 | 6,324 | 9,531 | 13,165 | 10,682 |
| 2000's | 15,226 | 14,563 | 7,194 | 8,207 | 5,293 | 5,292 | 2,618 | 1,721 | 411 | 1,322 |
| 2010's | 1,197 | 975 | 204 | 195 | 752 | 369 | 603 | 346 | 263 | 495 |
| 2020's | 501 |
| - = No Data Reported; -- = Not Applicable; NA = Not Available; W = Withheld to avoid disclosure of individual company data. |
| Release Date: 2/9/2022 |
| Next Release Date: Suspended |