|
Download Data (XLS File) |
|
|||||
|
|||||
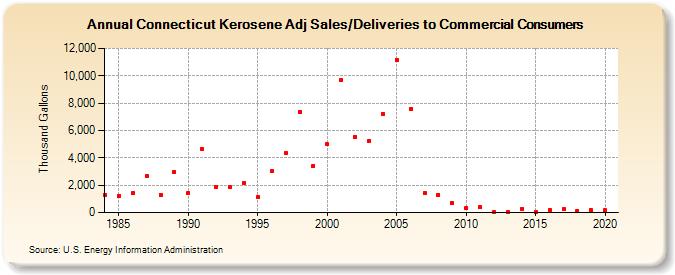
| Connecticut Kerosene Adj Sales/Deliveries to Commercial Consumers (Thousand Gallons) | |||||
| Decade | Year-0 | Year-1 | Year-2 | Year-3 | Year-4 | Year-5 | Year-6 | Year-7 | Year-8 | Year-9 |
|---|---|---|---|---|---|---|---|---|---|---|
| 1980's | 1,286 | 1,216 | 1,428 | 2,685 | 1,288 | 2,972 | ||||
| 1990's | 1,423 | 4,648 | 1,894 | 1,867 | 2,153 | 1,144 | 3,012 | 4,357 | 7,381 | 3,424 |
| 2000's | 4,978 | 9,684 | 5,546 | 5,241 | 7,227 | 11,177 | 7,604 | 1,425 | 1,305 | 710 |
| 2010's | 344 | 375 | 56 | 40 | 285 | 71 | 156 | 264 | 128 | 167 |
| 2020's | 152 |
| - = No Data Reported; -- = Not Applicable; NA = Not Available; W = Withheld to avoid disclosure of individual company data. |
| Release Date: 2/9/2022 |
| Next Release Date: Suspended |