|
Download Data (XLS File) |
|
|||||
|
|||||
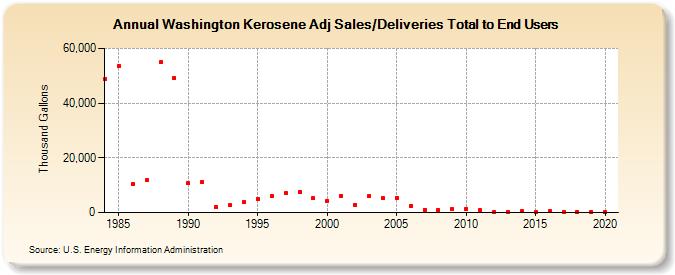
| Washington Kerosene Adj Sales/Deliveries Total to End Users (Thousand Gallons) | |||||
| Decade | Year-0 | Year-1 | Year-2 | Year-3 | Year-4 | Year-5 | Year-6 | Year-7 | Year-8 | Year-9 |
|---|---|---|---|---|---|---|---|---|---|---|
| 1980's | 48,647 | 53,581 | 10,302 | 11,721 | 54,926 | 49,093 | ||||
| 1990's | 10,664 | 11,154 | 1,987 | 2,656 | 3,752 | 5,081 | 5,972 | 6,999 | 7,581 | 5,203 |
| 2000's | 4,271 | 6,187 | 2,861 | 5,951 | 5,316 | 5,414 | 2,546 | 1,077 | 932 | 1,314 |
| 2010's | 1,373 | 810 | 323 | 275 | 399 | 235 | 447 | 279 | 225 | 363 |
| 2020's | 316 |
| - = No Data Reported; -- = Not Applicable; NA = Not Available; W = Withheld to avoid disclosure of individual company data. |
| Release Date: 2/9/2022 |
| Next Release Date: Suspended |