|
Download Data (XLS File) |
|
|||||
|
|||||
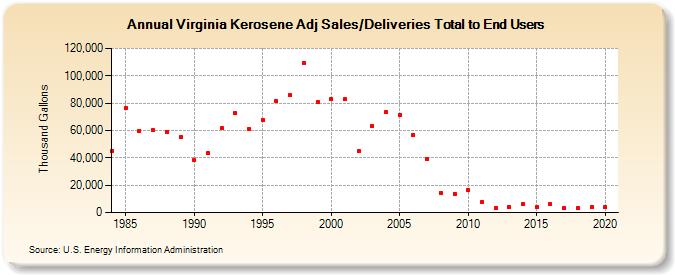
| Virginia Kerosene Adj Sales/Deliveries Total to End Users (Thousand Gallons) | |||||
| Decade | Year-0 | Year-1 | Year-2 | Year-3 | Year-4 | Year-5 | Year-6 | Year-7 | Year-8 | Year-9 |
|---|---|---|---|---|---|---|---|---|---|---|
| 1980's | 44,998 | 76,747 | 59,800 | 60,229 | 59,138 | 55,225 | ||||
| 1990's | 38,056 | 43,434 | 61,579 | 72,872 | 61,261 | 67,951 | 81,282 | 85,930 | 109,353 | 80,705 |
| 2000's | 82,922 | 82,820 | 44,911 | 63,231 | 73,654 | 71,208 | 57,028 | 39,018 | 14,604 | 13,796 |
| 2010's | 16,485 | 8,076 | 3,560 | 3,989 | 6,247 | 4,226 | 5,969 | 3,213 | 3,460 | 3,741 |
| 2020's | 4,206 |
| - = No Data Reported; -- = Not Applicable; NA = Not Available; W = Withheld to avoid disclosure of individual company data. |
| Release Date: 2/9/2022 |
| Next Release Date: Suspended |