|
Download Data (XLS File) |
|
|||||
|
|||||
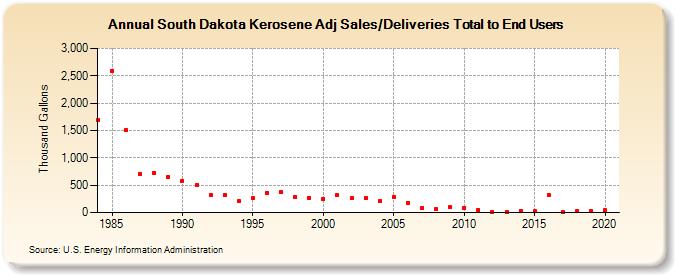
| South Dakota Kerosene Adj Sales/Deliveries Total to End Users (Thousand Gallons) | |||||
| Decade | Year-0 | Year-1 | Year-2 | Year-3 | Year-4 | Year-5 | Year-6 | Year-7 | Year-8 | Year-9 |
|---|---|---|---|---|---|---|---|---|---|---|
| 1980's | 1,699 | 2,594 | 1,508 | 706 | 729 | 652 | ||||
| 1990's | 583 | 508 | 327 | 314 | 208 | 259 | 364 | 368 | 283 | 275 |
| 2000's | 246 | 317 | 257 | 273 | 214 | 290 | 182 | 89 | 58 | 93 |
| 2010's | 88 | 47 | 16 | 18 | 35 | 20 | 322 | 14 | 20 | 26 |
| 2020's | 40 |
| - = No Data Reported; -- = Not Applicable; NA = Not Available; W = Withheld to avoid disclosure of individual company data. |
| Release Date: 2/9/2022 |
| Next Release Date: Suspended |