|
Download Data (XLS File) |
|
|||||
|
|||||
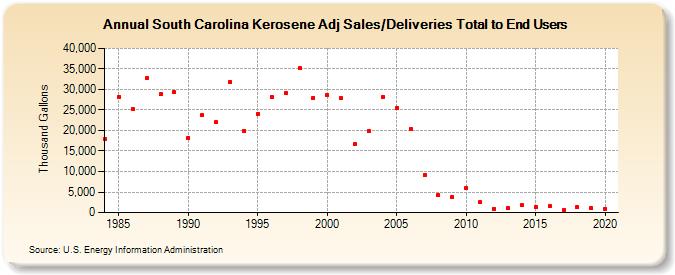
| South Carolina Kerosene Adj Sales/Deliveries Total to End Users (Thousand Gallons) | |||||
| Decade | Year-0 | Year-1 | Year-2 | Year-3 | Year-4 | Year-5 | Year-6 | Year-7 | Year-8 | Year-9 |
|---|---|---|---|---|---|---|---|---|---|---|
| 1980's | 17,944 | 28,257 | 25,154 | 32,695 | 28,782 | 29,256 | ||||
| 1990's | 18,243 | 23,672 | 22,009 | 31,913 | 19,890 | 24,094 | 28,254 | 29,168 | 35,152 | 28,010 |
| 2000's | 28,626 | 27,792 | 16,604 | 19,862 | 28,259 | 25,518 | 20,368 | 9,136 | 4,247 | 3,746 |
| 2010's | 6,039 | 2,543 | 952 | 1,021 | 1,762 | 1,263 | 1,511 | 705 | 1,275 | 1,088 |
| 2020's | 984 |
| - = No Data Reported; -- = Not Applicable; NA = Not Available; W = Withheld to avoid disclosure of individual company data. |
| Release Date: 2/9/2022 |
| Next Release Date: Suspended |