|
Download Data (XLS File) |
|
|||||
|
|||||
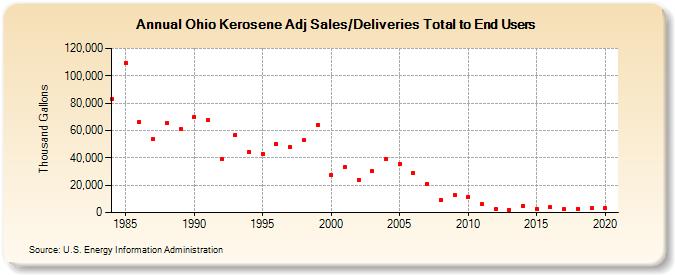
| Ohio Kerosene Adj Sales/Deliveries Total to End Users (Thousand Gallons) | |||||
| Decade | Year-0 | Year-1 | Year-2 | Year-3 | Year-4 | Year-5 | Year-6 | Year-7 | Year-8 | Year-9 |
|---|---|---|---|---|---|---|---|---|---|---|
| 1980's | 82,773 | 109,192 | 66,388 | 53,865 | 65,774 | 60,754 | ||||
| 1990's | 69,919 | 67,347 | 39,144 | 56,798 | 44,627 | 43,025 | 50,167 | 48,057 | 52,722 | 64,108 |
| 2000's | 27,160 | 33,268 | 24,071 | 30,473 | 39,212 | 35,372 | 29,193 | 21,013 | 9,407 | 12,967 |
| 2010's | 11,653 | 5,904 | 2,305 | 2,191 | 4,816 | 2,962 | 3,841 | 2,390 | 2,878 | 2,996 |
| 2020's | 3,490 |
| - = No Data Reported; -- = Not Applicable; NA = Not Available; W = Withheld to avoid disclosure of individual company data. |
| Release Date: 2/9/2022 |
| Next Release Date: Suspended |