|
Download Data (XLS File) |
|
|||||
|
|||||
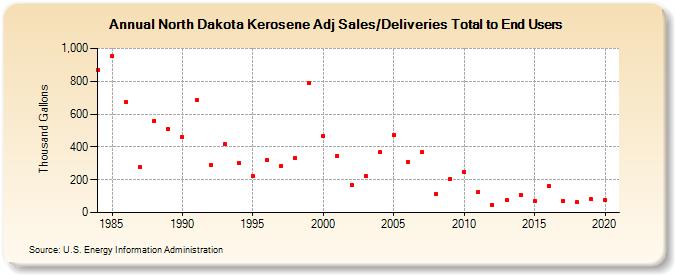
| North Dakota Kerosene Adj Sales/Deliveries Total to End Users (Thousand Gallons) | |||||
| Decade | Year-0 | Year-1 | Year-2 | Year-3 | Year-4 | Year-5 | Year-6 | Year-7 | Year-8 | Year-9 |
|---|---|---|---|---|---|---|---|---|---|---|
| 1980's | 871 | 951 | 675 | 278 | 560 | 507 | ||||
| 1990's | 460 | 686 | 291 | 417 | 302 | 224 | 322 | 284 | 335 | 789 |
| 2000's | 465 | 345 | 170 | 224 | 367 | 471 | 311 | 370 | 113 | 205 |
| 2010's | 250 | 127 | 49 | 76 | 107 | 69 | 164 | 71 | 62 | 81 |
| 2020's | 76 |
| - = No Data Reported; -- = Not Applicable; NA = Not Available; W = Withheld to avoid disclosure of individual company data. |
| Release Date: 2/9/2022 |
| Next Release Date: Suspended |