|
Download Data (XLS File) |
|
|||||
|
|||||
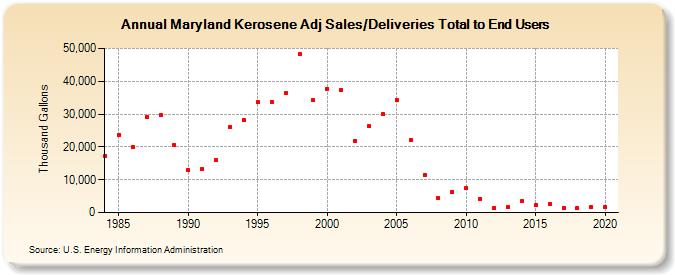
| Maryland Kerosene Adj Sales/Deliveries Total to End Users (Thousand Gallons) | |||||
| Decade | Year-0 | Year-1 | Year-2 | Year-3 | Year-4 | Year-5 | Year-6 | Year-7 | Year-8 | Year-9 |
|---|---|---|---|---|---|---|---|---|---|---|
| 1980's | 17,186 | 23,731 | 19,927 | 29,085 | 29,596 | 20,643 | ||||
| 1990's | 12,899 | 13,243 | 15,864 | 26,103 | 28,210 | 33,662 | 33,693 | 36,335 | 48,141 | 34,186 |
| 2000's | 37,701 | 37,440 | 21,885 | 26,273 | 29,992 | 34,212 | 22,247 | 11,502 | 4,441 | 6,363 |
| 2010's | 7,480 | 4,259 | 1,471 | 1,555 | 3,377 | 2,294 | 2,632 | 1,503 | 1,275 | 1,635 |
| 2020's | 1,781 |
| - = No Data Reported; -- = Not Applicable; NA = Not Available; W = Withheld to avoid disclosure of individual company data. |
| Release Date: 2/9/2022 |
| Next Release Date: Suspended |