|
Download Data (XLS File) |
|
|||||
|
|||||
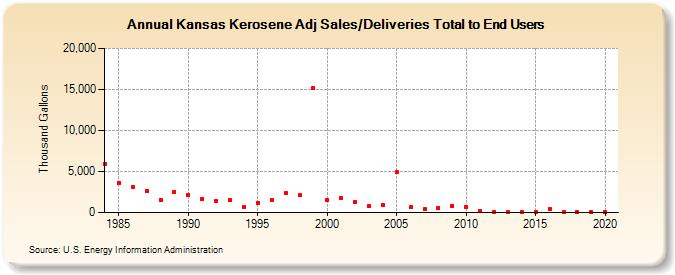
| Kansas Kerosene Adj Sales/Deliveries Total to End Users (Thousand Gallons) | |||||
| Decade | Year-0 | Year-1 | Year-2 | Year-3 | Year-4 | Year-5 | Year-6 | Year-7 | Year-8 | Year-9 |
|---|---|---|---|---|---|---|---|---|---|---|
| 1980's | 5,943 | 3,641 | 3,167 | 2,654 | 1,580 | 2,538 | ||||
| 1990's | 2,122 | 1,688 | 1,378 | 1,522 | 733 | 1,197 | 1,549 | 2,436 | 2,092 | 15,124 |
| 2000's | 1,517 | 1,721 | 1,295 | 823 | 916 | 4,982 | 641 | 399 | 581 | 840 |
| 2010's | 619 | 169 | 78 | 67 | 107 | 95 | 426 | 41 | 65 | 73 |
| 2020's | 79 |
| - = No Data Reported; -- = Not Applicable; NA = Not Available; W = Withheld to avoid disclosure of individual company data. |
| Release Date: 2/9/2022 |
| Next Release Date: Suspended |