|
Download Data (XLS File) |
|
|||||
|
|||||
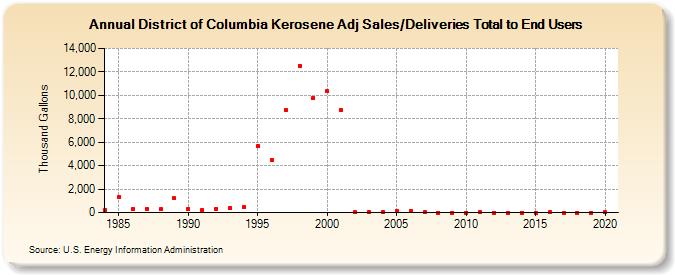
| District of Columbia Kerosene Adj Sales/Deliveries Total to End Users (Thousand Gallons) | |||||
| Decade | Year-0 | Year-1 | Year-2 | Year-3 | Year-4 | Year-5 | Year-6 | Year-7 | Year-8 | Year-9 |
|---|---|---|---|---|---|---|---|---|---|---|
| 1980's | 191 | 1,293 | 278 | 320 | 281 | 1,204 | ||||
| 1990's | 304 | 222 | 329 | 394 | 438 | 5,667 | 4,510 | 8,761 | 12,538 | 9,759 |
| 2000's | 10,341 | 8,709 | 12 | 24 | 34 | 113 | 115 | 40 | 2 | 5 |
| 2010's | 4 | 15 | 0 | 1 | 3 | 0 | 14 | 1 | 0 | 1 |
| 2020's | 11 |
| - = No Data Reported; -- = Not Applicable; NA = Not Available; W = Withheld to avoid disclosure of individual company data. |
| Release Date: 2/9/2022 |
| Next Release Date: Suspended |